
|
A popular Introduction to Psychology textbook challenges the reader to memorize a string of letters:
C I A N S A K G B F B I D O J This is a difficult task for most people – the 15-letter string exceeds the magical number seven 1 rule for information processing. However, when shown the following string:CIA NSA KGB FBI DOJ most people are able to recall it perfectly after a very short period of time. The information is exactly the same; it is the relationship between the reader and the data that has changed. Visual design matters. |
The human mind is capable of processing, very quickly, a large volume of complex information – if it is presented in the right way. Charles Joseph Minard's visualization of Napoleon's disastrous 1812 Russia campaign is a great example of proper presentation. Edward Tufte2 has called it ”the best statistical graph ever drawn”3.

The graphic communicates, simultaneously, the size of Napoleon’s invading force, its geographic position and direction of movement, and the recorded temperature. The brilliant visual design ensures that complex, interlinked variables are immediately and intuitively interpreted as a cohesive whole.
Great graphic design does not have to be limited to serious topics – in addition to being informative, it can be amusing, beautiful, decorative, irreverent, witty – ideally, all of the above. Pop Chart Lab, a design collaborative, has produced some of my favorite examples of exactly this kind of graphic design.
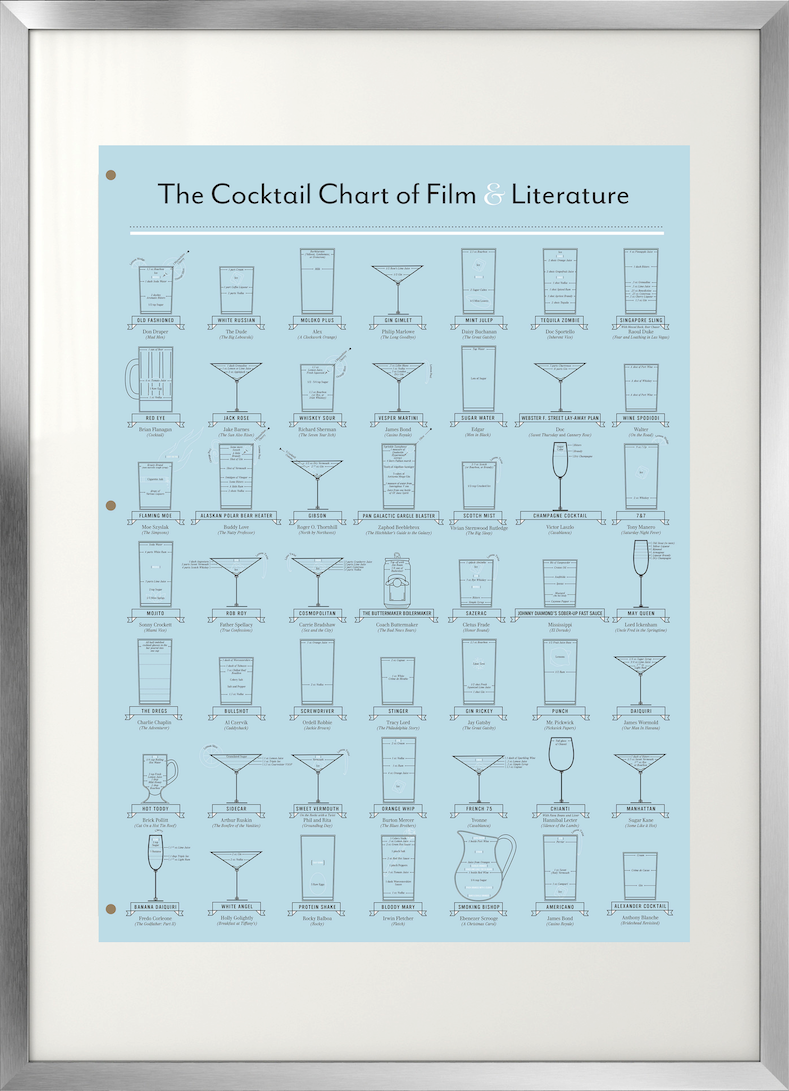
For the literary connoisseur with a pop-culture streak, Pop Chart Lab offers The Cocktail Chart of Film & Literature, featuring classics such as the whiskey sour and the cosmopolitan, as well as the more recent additions to the blended beverage repertoire.
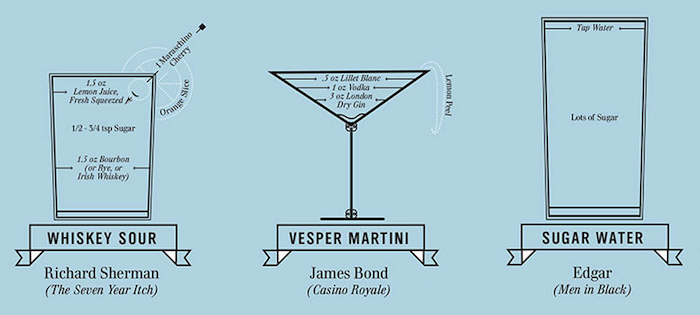
The design is clean, almost stark, with limited colors and streamlined graphics. At the same time, the visuals convey a plethora of information – the name of the featured drink, its native novel or film, the character imbibing the concoction, ingredients and their measures, the appropriate serving glass and even the recommended garnish.
The overall design is a stylized film script, the abstracted stack of pages in ”double blue” ( the color-code for the final script) held together by the three brass split pins. A script is the intermediate phase in the metamorphosis of a novel into film – a toast to all the great cocktails immortalized on the Silver Screen.

For those interested in all things typographical, Pop Chart Lab has devised the Alphabet of Typography.


For the architecture aficionado, Splendid Structure of New York City offers a virtual tour of the city’s most significant landmarks.


As a decorative element, posters often suffer from an unfavorable perception of immaturity; an object best reserved for college dorm rooms. This is both unfair and impractical - not everyone can afford original art, even from a lesser-know artist. More importantly, a beautiful poster is art in its own right. The key to a fabulous poster presentation lies, unsurprisingly, in how the poster is framed - you need to create the right context for the viewer. Choose a quality frame with a wide mat - this immediately draws the eye to the artwork and creates a lot of negative space, elevating and enhancing the visual experience.

For the Splendid Structure of New York City, I suggest the Ribba frame in glossy grey. The neutral color anchors the graphics and enhances the blueprint look.

For the Alphabet of Typography, the Ribba frame in glossy red echos the graphic's bursts of primary color. The bold color choice is also in line with the subject matter - a well-designed font should grab your attention.

For The Cocktail Chart of Film & Literature, the brushed aluminum Ribba frame subtly references the finish of a cocktail shaker. Alternatively, a white frame provides a clean and modern look.
To forestall any potential frustration and disappointment, it is worth mentioning that Ikea's product selection varies by country. If your preferred frame color is not available, purchase the aluminum frame (available in most markets) and paint it with an enamel spray paint in the desired color.
As a small design bonus, Pop Chart Lab has created the (possibly) only greeting card you would ever need (click image to enlarge).

Suitable for all occasions, it offers a total of 276 different felicitations in a single card. I find especially thoughtful (and amusing) the inclusion of less positive sentiments.

Interested in the minute details of great visual design? Through June 3rd, 2015, the Ladislav Sutnar: Visual Design in Action - Facsimile Edition project is looking for funding on Kickstarter. Sutnar is one of the lost masters of graphic design, a pioneer of data visualization, the man responsible for the now ubiquitous parenthesis framing the area codes in US phone numbers. 5
1 Miller, G. A. ”The magical number seven, plus or minus two: Some limits on our capacity for processing information.” Psychological Review 63(1956): 81–97.
Figurative Map of the successive losses in men of the French Army in the Russian campaign 1812-1813.
Drawn by Mr. Minard, Inspector General of Bridges and Roads in retirement. Paris, 20 November 1869.
The numbers of men present are represented by the widths of the colored zones in a rate of one millimeter for ten thousand men; these are also written beside the zones. Red designates men moving into Russia, black those on retreat.
The informations used for drawing the map were taken from the works of Messrs. Chiers, de Ségur, de Fezensac, de Chambray and the unpublished diary of Jacob, pharmacist of the Army since 28 October.
In order to facilitate the judgement of the eye regarding the diminution of the army, I supposed that the troops under Prince Jèrôme and under Marshal Davoust, who were sent to Minsk and Mobilow and who rejoined near Orscha and Witebsk, had always marched with the army.
No comments:
Post a Comment